Learning Analytics & Insights
Knowwhat's working
Analytics that connect learning to business impact without the spreadsheets.
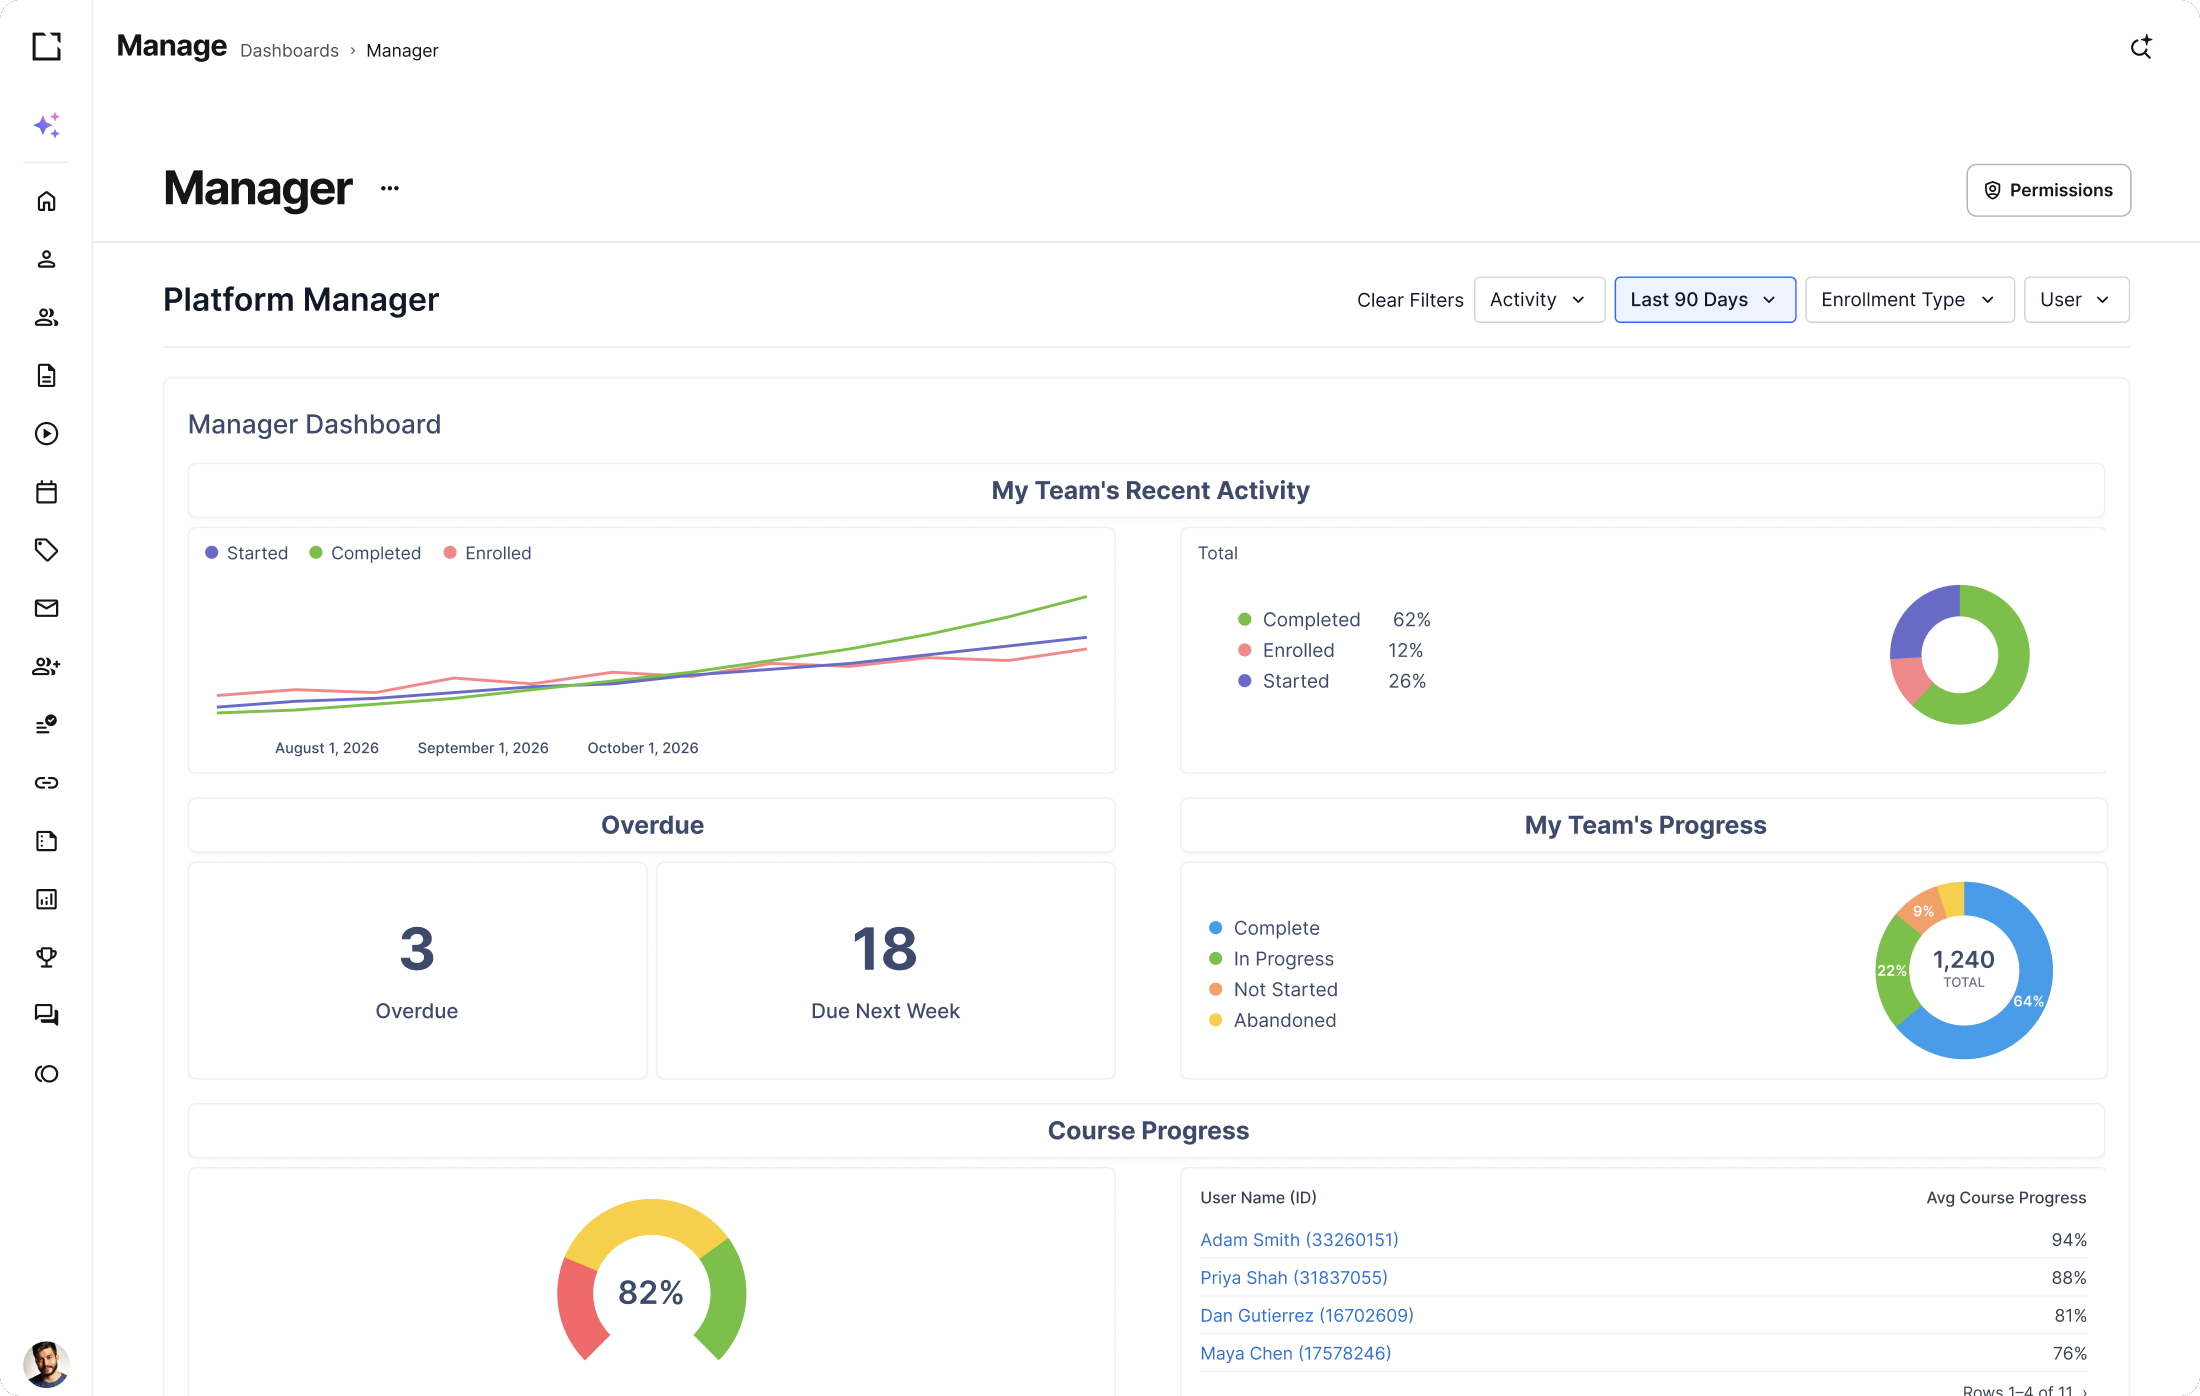
From data to decisions, instantly
Most learning platforms can show completions. Intellum shows impact. Intellum analytics connect learning activity to the KPIs that matter, such as revenue, retention, adoption, compliance and productivity, so you can prove value and improve outcomes.
What makes Intellum different

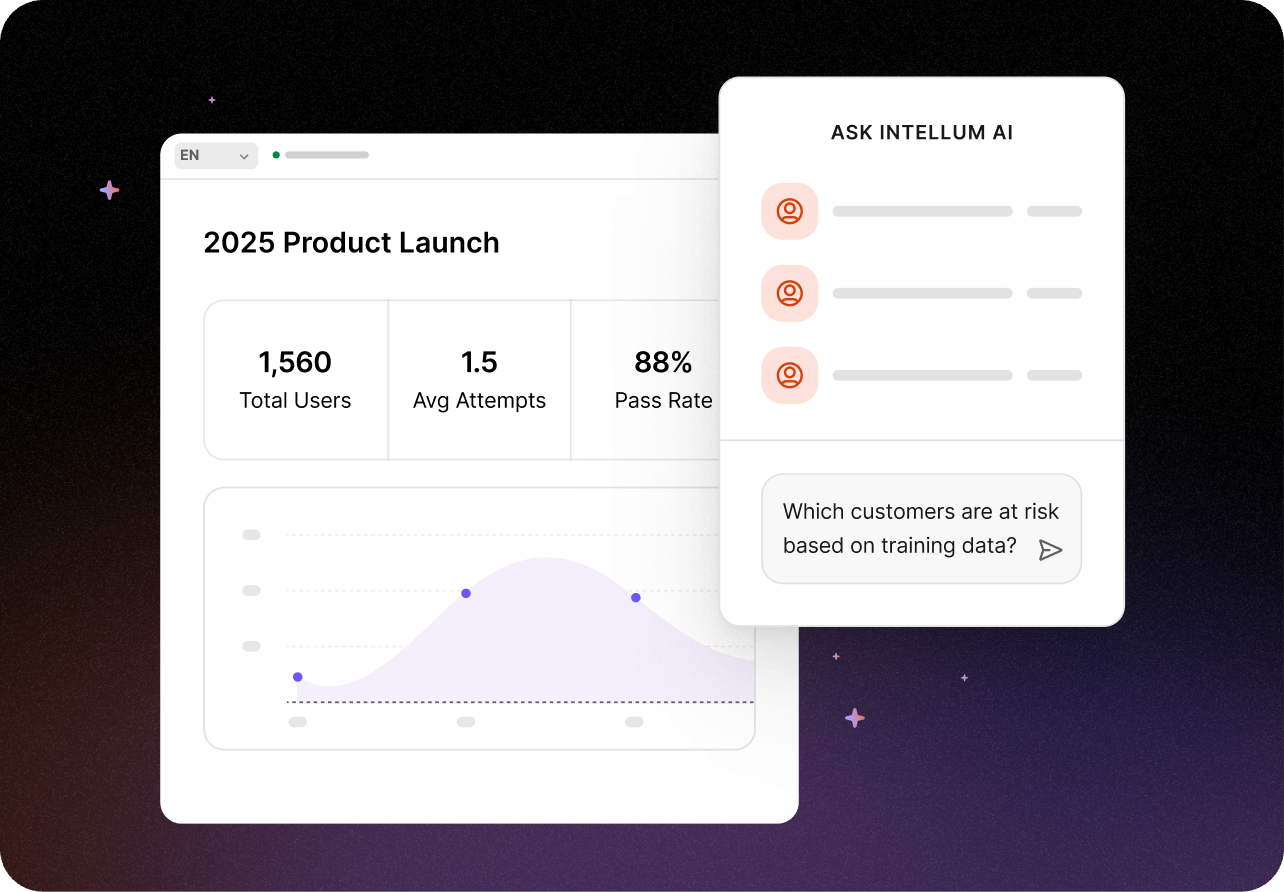
Conversational Queries
Ask a plain-language question such as “Which customers are at risk based on training data?” and get an answer right away.

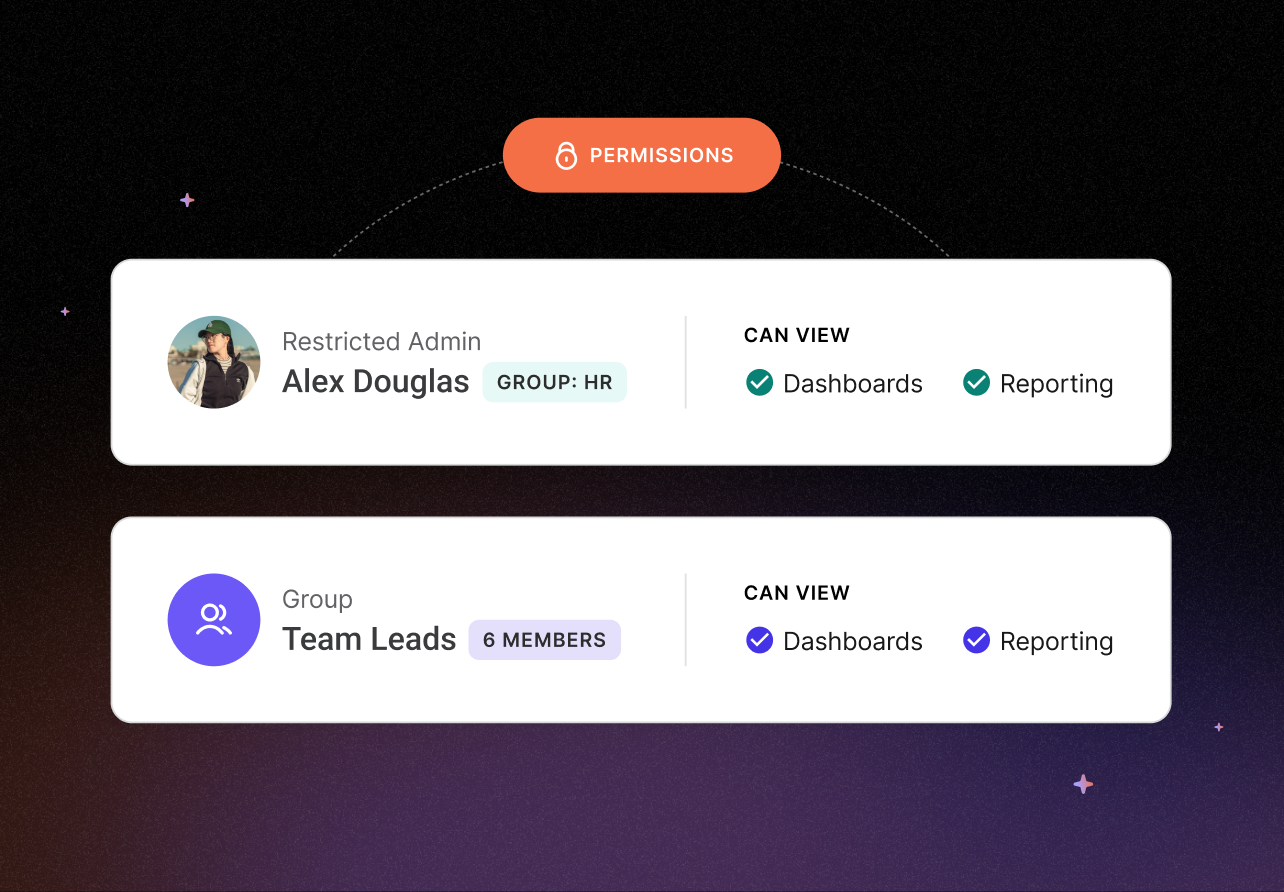
Permission-Controlled Insights
Ensure the right people see the right data with enterprise-grade role-based controls.

Unified Data Layer
Learning content, engagement data and user actions are tracked in one structure, so analysis is richer and faster.

Automated Trend Analysis
Surface patterns in performance, compliance, and engagement automatically. Spot issues before they affect business outcomes.

Impact Dashboards
Visualize learning’s influence on KPIs across audiences, regions, or programs.
Results customers have measured


Questions about learning analytics
Learning analytics is the practice of collecting and analyzing data about how people learn, such as completions, engagement, assessment scores, and skill growth. Teams use it to see whether training is working and where to improve.
Track completion and engagement, then connect them to business outcomes like adoption, retention, certification, and revenue. Intellum reports on learning activity, and the Data Connector puts the full dataset in BigQuery every hour, so you can analyze it next to business metrics.
Send learning data to where your business data already lives. The Data Connector refreshes the full Intellum dataset in BigQuery every hour, and PubSub streams changes within seconds, so analysts can model learning against revenue, product usage, and retention in the BI tools they already use.
Tie learning data to the business metric the program targets, such as support deflection, adoption, or renewal rate. Intellum connects learning activity to those outcomes, so you can show impact in dollars alongside completions.
Prove learning impact on one platform
Analytics built on one data layer for content and learning events, with the insight you need when you need it.